The Standards Report is a visual report for administrators that contains standards performance data for all assessed standards in their school or district. Administrator reports update nightly (every 24 hours).
⚠️ Visual reports are only accessible within the current school year. Once a school year reaches its end date, visual reports are no longer accessible in the platform. Administrators can access prior year assessment data by exporting CSV reports.
⚠️ For Wit & Wisdom and Arts & Letters: Administrators must drill down into the standards hierarchy before data will populate, as standards are not tagged at the top level of the hierarchy for Humanities curricula. Once administrators choose their desired grade level, they can select a domain from the hierarchy section of the report to drill down.
Access the Report
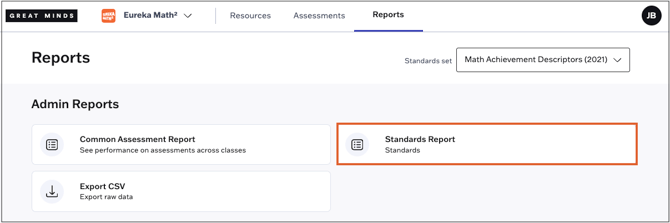
To access the report, navigate to Reports using the main menu and select Standards Report from the Reports page.
Filter Report Data
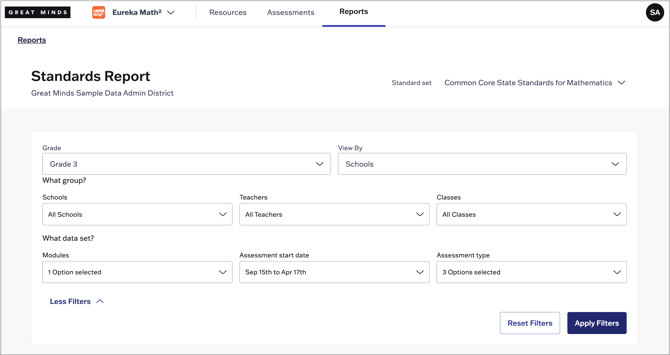
If your organization has multiple standards sets assigned, select your desired standards set using the drop-down at the top right.
⚠️ Select a Standard set prior to applying filters to the report data. If you change the standard set after applying filters, you will receive a "There is no data available" error.

- Select the applicable Grade from the drop-down menu.
- Under View By, you can choose to aggregate the report data by Schools, Teachers, or Classes.
- Select More Filters to narrow the dataset by the following parameters:
- School
- Teacher
- Class
- Module
- Assessment start date
- Assessment type
Click Apply Filters to apply your filter selections to the report data.
Report Sections
Insights
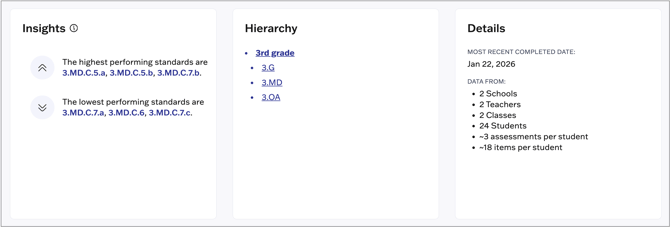
The Insights section provides an at-a-glance summary of the highest and lowest performing standards in the school or district. Click on any of the standards listed to view the report for that specific standard.
Hierarchy
This section lists the standard domains for the selected grade level. Choose a domain to drill down and view performance data specific to that domain.
Details
The Details section provides a breakdown of the number of schools, teachers, classes, and students included in the report data. You can also see the average number of assessments and items completed per student.
Student Breakdown
This section shows the percentage of students that fall into each performance band for all standard domains in the report.
-
Click any of the percentages shown to see a count of students within the selected proficiency band.
- Use the drop-down at the top right to select your desired data format: Student Counts or Percentages
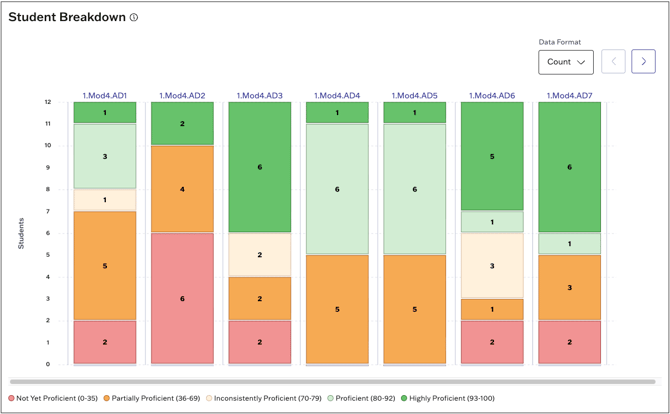
At the lowest level of the standards hierarchy, the bar chart breaks down student performance across all assessments for the chosen standard.

Performance By Standard
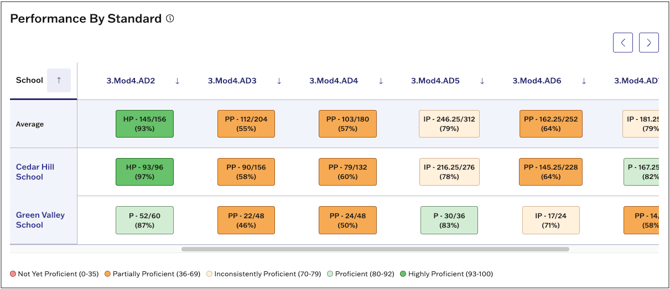
This section shows aggregate performance on each standard in the selected grade level or domain broken down by school, class, or teacher (depending on the report filters selected).